
What is JENNIFER Application Performance Monitoring (APM) for DevOps?
Application Performance Management (APM) is an essential part of a business infrastructure that is critical for the prevention of application failures as well as service interruptions. In business operations, these obstacles could have serious impacts on the company’s competitiveness. With the deployment of APM, applications can be operated more stably through fault detection, monitoring, and advanced prevention techniques.
There are many steps and complex dependencies involved in system development and operations management. APM solutions typically come into play after system development, more specifically, after the integrated performance testing stage. After the system is launched, APM underpins monitoring and long-term performance management. This is highly useful, considering that performance failures are mostly caused by application implementation issues during actual operations.

As an answer for the complexity in web application system, JENNIFER APM features mobile cloud connectivity which fits the requirements of today’s customers, web service real-user monitoring for the complete monitoring system in the big data market, as well as web service-oriented topology view and architecture in consideration of the cloud environment (large scale system). The system also supports the HTML 5-based N-Screen.
JENNIFER also enables the monitoring of each transaction that takes place in the Web Application Server. Moreover, JENNIFER’s advanced capabilities include monitoring of transactions in the DB, external services, HTTP server, and other subsystems associated with the Web Application Server.
What will you get by purchasing the product?
Integrated Performance Monitoring

JENNIFER provides comprehensive and integrated performance monitoring through its many dashboard views, which include Real-user Monitoring and Real-time Topology.
Fast Problem Troubleshooting

JENNIFER’s continuous monitoring helps with the rapid detection and troubleshooting of performance problems. In operation, this can help prevent problems from affecting service availabilities.
Service Availability

JENNIFER analyzes statistical data regarding system resources, application performance and errors which greatly effective to achieve continuous and optimal service availability.
Improved Customer Satisfaction

Minimizing system downtime and improving overall performance at the application and system levels will lead to significant improvement in Customer Satisfaction.
Here are the detailed features of the product:
01. Real-time Transaction Monitoring
JENNIFER traces all transaction processes from request entry to the exit of the web application server in real-time. JENNIFER shows colored transaction bars according to the elapsed time of each transaction being processed. This serves as a real-time indicator to see whether your web application server has slow transactions or not.
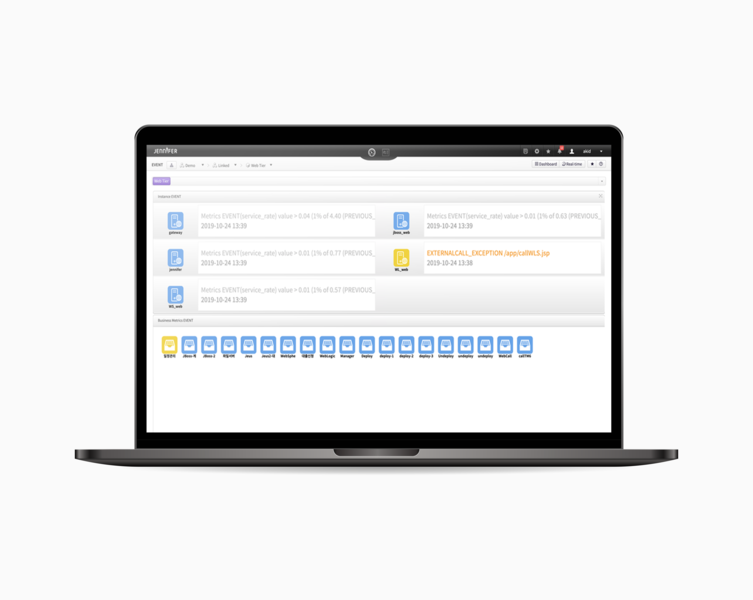
02. Real-time Event Alerts
JENNIFER catches abnormal application transaction events such as transactions of bad response time, transaction error/ exception and Bad SQL statement, etc, and subsequently, issues alert in real-time.
03. Real-time Data Analytics
- Active Service Data Analytics
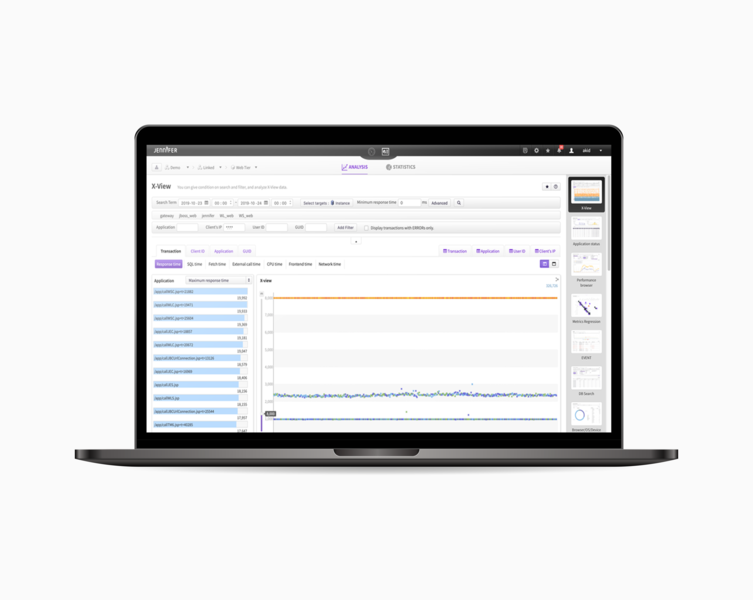
Real-Time stack trace dump of JENNIFER helps you to pinpoint abnormal method behavior in process of transactions inside the application server. - X-View Data Analytics
Allows the commencing of analytic in real-time. You don’t need to wait to analyze transactions after requests are finished. You can simply observe the ‘X’ dots of the upper area on X-View, and drag to a certain area. ‘X’ includes all of the details of each transaction to analyze as soon as the transaction is done.

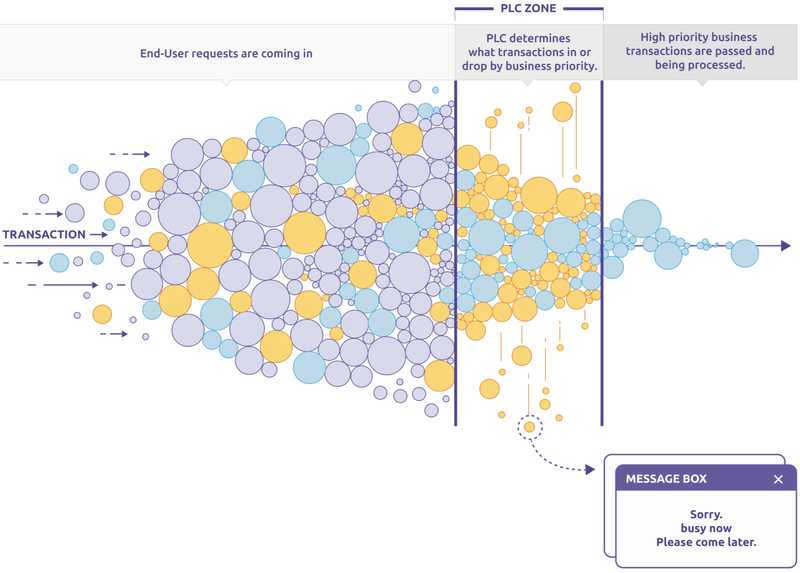
04. Real-time Trouble Control
Real-time trouble Control features of JENNIFER guarantees the stable web system running in unexpected “disastrous” situations.
05. AutoRun
AutoRun takes emergency measures even if the administrator is unavailable. Autorun feature runs a pre-defined command when the web system gets into trouble.

